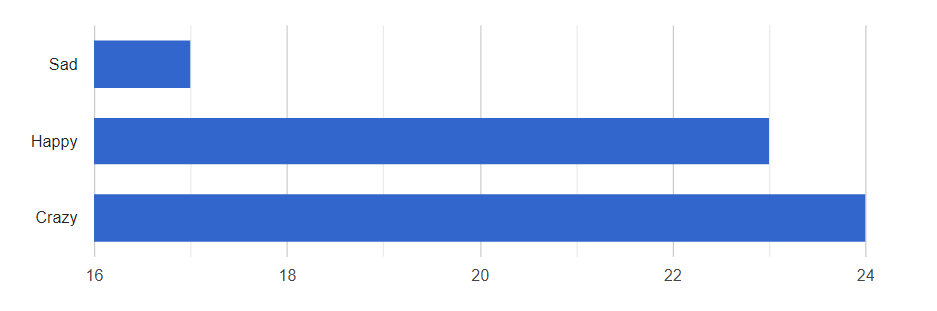
Do you want to show data from your Gravity Forms in a (complex) Bar Chart? There is only one plugin you should use: GF Chart. You can easily make Bar charts (even very complex ones) from the data visitors of your website filled in on your website.
Example Bar Chart GFCharts
How to make a Complex Bar Chart with GFChart?
Just install the plugin and make a Gravity Form with a radio button or drop down field. In the WP-admin area go to ‘Forms ->’Charts/Calculations’. Add a new Chart and select the right form. You can use GF Chart with many other fields as well, but for this example, we use a Radio Button as basis.
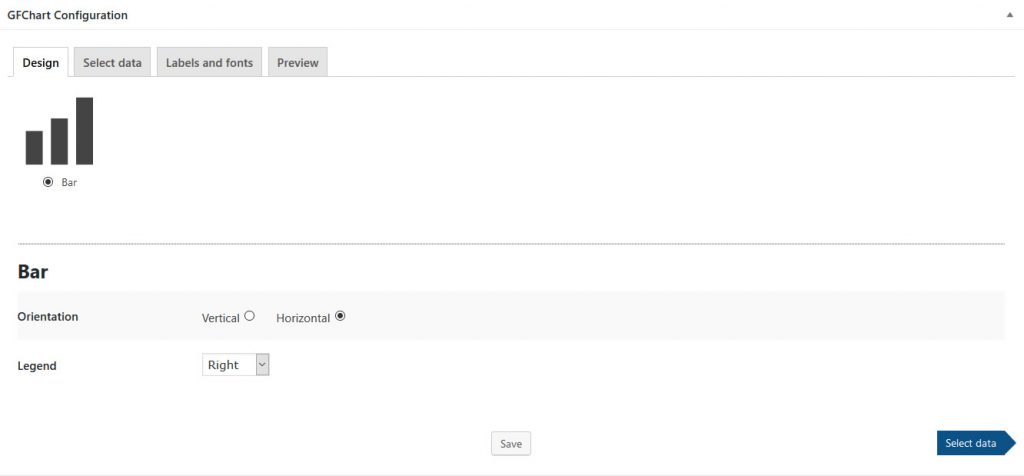
Step 1: Design
You choose for the Bar and for the Horizontal option. There is an option to choose for where to place the legend relative to the Bar chart.
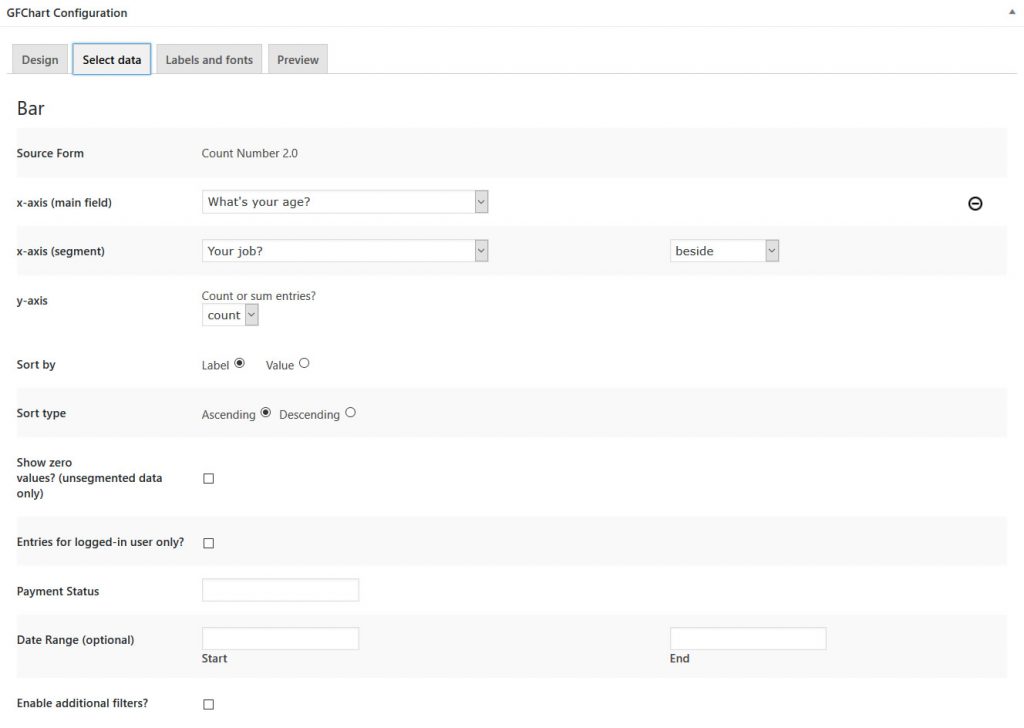
Step 2: Select Data
Which field(s) should be the basis of your bar chart? There are different options to specify, but that is not needed to go into. If you are a professional user of Gravity Forms, it’s nice to have these extra options!
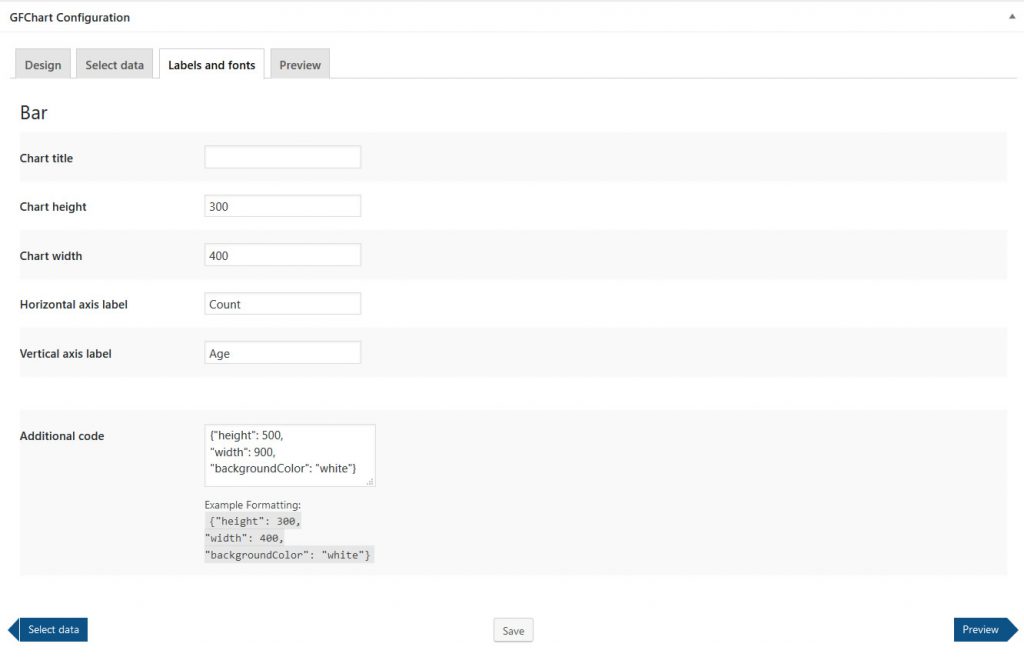
Step 3: Configuration
The Gravity Forms Charts plugin gives you some options to style your Bar Chart, like height and width.
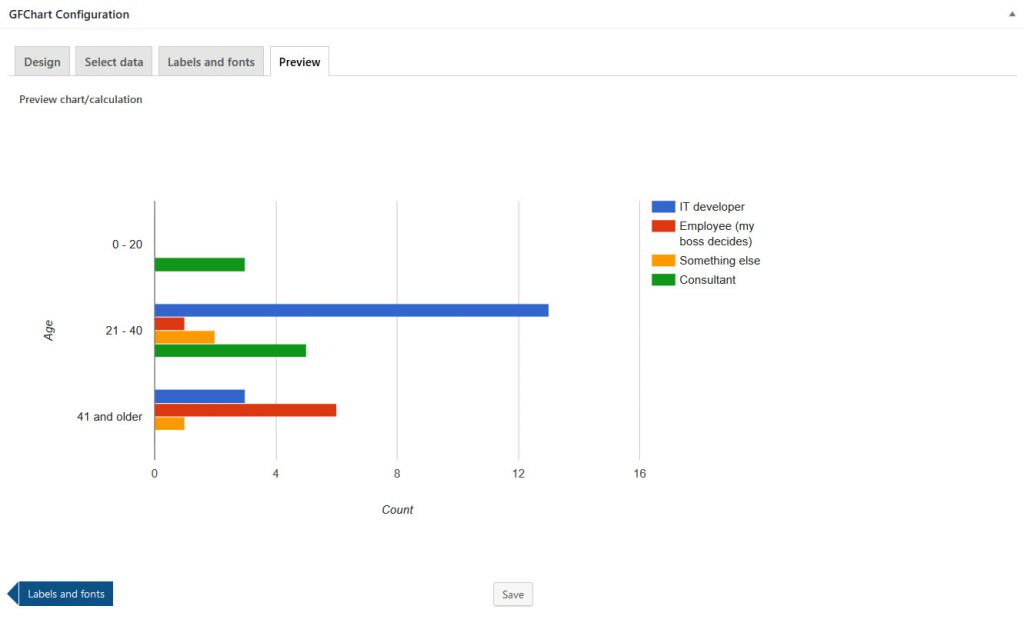
Step 4: Preview
GF Charts gives you on the spot a preview of the chart you’re making. Not satisfied? Change it in the previous steps. Satisfied? Use the simple shortcode to place it anywhere on your website.
Our Premium add-ons for Gravity Forms

List Number Format
With this Gravity Forms Add-on you can change List Field columns into a number field, do calculations within a row or column. Extra merge tags are available with total counts of columns.

Advanced Merge Tags
This Gravity Forms Add-On adds extra Merge Tag modifiers (and a lot of power). From the most common used functions like capitalize and length to changing date formats.

List Text
Add features like textarea, placeholder and custom validation to a column or multiple columns in a Gravity Forms List Field.

Advanced Number Field
Functionality for Number Fields, like rounding or only absolute numbers, fixed point notation, range calculation, custom units like % or m2 & show as slider.
Read tutorials about

How to Create a Public Submission Business Directory in WordPress (Gravity Forms + GravityView)
Build a moderated business directory where users submit listings through a form, admins approve entries, and approved businesses appear in a searchable GravityView directory.

How to Create an Event Workshop Registration + Waitlist System in WordPress
This guide shows how to set up a workshop registration + waitlist system in WordPress: register attendees until capacity is reached, waitlist the rest, approve entries, and auto-promote people when a seat opens using Gravity Forms, Gravity Flow, and GravityView.

Gravity Flow Form Submission Step Tutorial
The Gravity Flow Form Submission step pauses a workflow until another form is submitted, then continues once the handoff is complete. This guide shows how to connect two forms, prefill fields with mapping, send the correct secure link, and troubleshoot the most common “workflow didn’t move” issues.

Gravity Flow Delete an Entry Step Tutorial
The Gravity Flow Delete Entry step lets you trash or permanently remove Gravity Forms entries as part of a workflow. This guide covers the key settings, scheduling options (delay or date-based), and safe testing tips so you can follow retention and privacy rules with confidence.

